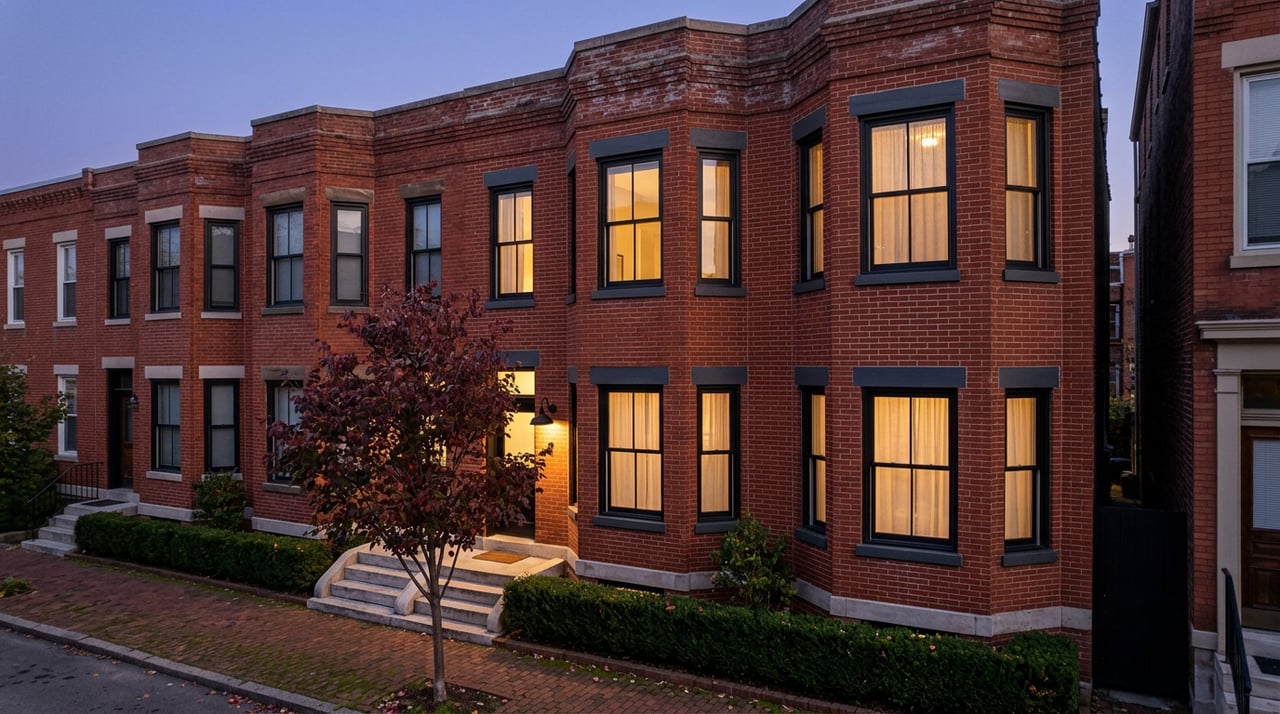
Pull up Medford on four different portals this month and you will get four different stories. Zillow reads the average home value at $855,081, up 1.8% over the past year. Redfin puts the median sale at $852K over the three months ending May 2026, down 4.8% versus the same period a year ago, with homes selling after 21 days. BMN Boston, using live MLS data through July 2026, shows a $833K median list price with year-over-year change of about 0.1%. Movoto has the July 2026 median list at $840K, a 2% decrease against July 2025.
Four sources, four directions, one city. The reason is not methodology. The reason is that "Medford" stopped being a single housing market on December 12, 2022, and the citywide median has been arithmetic without meaning ever since.
Two markets under one ZIP prefix
The Green Line Extension's Medford Branch opened on December 12, 2022, adding rapid transit access at Ball Square and Medford/Tufts. Three years in, the pricing effect has separated from the announcement effect and shown up in the neighborhood-level data.
Look at the two ends of the city and the split is obvious:
| Sub-market | Median (most recent) | YoY | Days on market |
|---|---|---|---|
| South Medford (station-adjacent) | $903K, up 9.1% YoY in March 2026 | +9.1% | 34 days vs. 58 a year earlier |
| West Medford (non-station core) | $922K, down 5.9% YoY | -5.9% | ~20 days |
| Citywide (Redfin 3-mo) | $852K, down 4.8% YoY through May 2026 | -4.8% | 21 days |
South Medford closed offers faster this March than it did a year earlier, and at a higher price. West Medford's price slid while its speed held roughly steady. Averaging the two gives you the citywide median, which is exactly the number the portals are quoting and exactly the number that is telling you nothing about the house you are actually bidding on.
What the GLX actually did to the map
Real estate activity near College Avenue and Ball Square has intensified, with buyers actively seeking homes within a half mile of these new stations and single-family homes, condos, and multifamily properties in these zones seeing competitive offers, reduced days on market, and higher per-square-foot pricing. That description matches the South Medford numbers cleanly. What it does not match is the West Medford data, which sits a mile and a half from the nearest Green Line platform and reads more like a commuter suburb repricing after a rate cycle than a transit-adjacent submarket.
The context matters. Across the 37 cities and towns tracked by BMN, closings were essentially flat in the 30 days ending June 5, 2026, but the Cambridge–Somerville–Brookline inner walkable core saw its median sale price fall 12.0% year-over-year, from $1,230,000 to $1,082,000. When the inner core softens, the marginal buyer who would have paid $1.08M in Somerville looks north one T stop and finds a South Medford house near Ball Square for roughly $200K less. That buyer is the person driving the +9.1% at the station end of Medford while the rest of the market cools.
Medford is not one market cooling by 4.8%. It is a station-adjacent submarket appreciating like Somerville used to, glued to a non-station submarket repricing like every other outer-ring town north of Route 16.
What your money actually buys, on each side of the line
At $900K, the two Medfords hand you fundamentally different assets.
Near the Ball Square platform or up College Avenue toward Medford/Tufts, $900K is buying you a smaller footprint on a smaller lot with a T ride to Lechmere. Houses in the area of College Avenue have an average assessment of $1,383,050, an average lot of 0.47 acre, and an average build year of 1916. You are paying for entitlement to the station walk shed, and you are competing with the buyer who was priced out of a two-bed condo in East Somerville.
In West Medford or the pockets farther from the transit corridor, the same $900K is buying more house and more lot. Buyers are getting real houses with yards, driveways, and room to breathe; in Cambridge or Somerville, $800,000 might get a cramped two-bedroom condo, while in Medford, the equivalent budget is looking at a three-bedroom house with meaningful outdoor space. The catch: your comps are moving in the opposite direction from the station-side comps, and the appraiser is going to know that.
The friction that only surfaces at offer time
Three things break down for buyers who underwrite Medford as a single market:
- Appraisal risk cuts one way. Waived-appraisal offers priced to a citywide median can leave a station-adjacent buyer overpaying against nearby non-station comps that dragged the average down. The MLS does not distinguish "walk to Ball Square" from "walk to nothing" in the comparable set the appraiser pulls.
- Days-on-market averages hide the real bidding tempo. BMN's citywide 67-day figure and Redfin's 21-day figure look like different cities because they measure different denominators. Station-adjacent single-families in South Medford are closing well inside the citywide average, and if you write a 10-day inspection contingency to match a 67-day-market pace, you are the second offer.
- Sellers on the non-station side are pricing to old comps. Many homes get multiple offers, some with waived contingencies, and the average home sells for about 2% above list price and goes pending in around 21 days. That 2%-over-list statistic is a citywide blend. Sellers on the West Medford side who anchor to it are seeing price reductions instead. Buyers who assume every list price is soft get caught flat-footed on the South Medford side.
The neighborhood texture the numbers don't carry
The commercial story is doing the same split as the housing story. Medford Square has quietly turned into a food destination since El Tacuba opened at 35 Salem Street from the brothers behind the Tenoch taco and torta group, alongside Bistro 5, Matsuba Izakaya, The Hollows, and Plazita Mexico Tacos. Meanwhile Wellington is being repositioned around late-night traffic near Fellsway Plaza, with Cilantro's Mexican Grill launching a second location at 495 Riverside Avenue in the former Smashburger space, which closed in January after more than a decade. These are two different demand signals landing in two different parts of the city, and they line up neatly with the two housing submarkets.
The Downtown-Medford dinner scene supports the South Medford price story. The Wellington repositioning is the retail equivalent of the outer-ring housing story: functional, priced for turnover, and largely disconnected from the T map.
A cleaner way to read a Medford listing this fall
Before you look at price, do this:
- Measure the actual walk from the front door to a Green Line platform. Under 12 minutes and you are underwriting the South Medford market. Over 20 minutes and you are underwriting the West Medford / outer-Medford market. In between is the contested band where portal medians are least useful.
- Pull three months of sold comps within that walk-shed, not within the ZIP. If your comp set crosses the line, the median it produces will not match either submarket.
- Ask whether the seller priced to citywide data or to walk-shed data. If a station-adjacent listing is priced to the citywide $840K figure, it will not be there long. If a non-station listing is priced to the +9.1% South Medford tape, it will sit.
For a broader read on how the inner-core cooling is repricing the whole northern arc, our take on the Cambridge citywide median covers the same mechanism one municipality south. For buyers weighing the two cities directly, choosing between Medford and Somerville is worth reading alongside this.
FAQ
Why do Zillow and Redfin disagree so sharply on Medford's direction right now? They are measuring different things. Zillow's $855,081 figure is an average home value model updated through late June 2026, up 1.8% year over year, while Redfin's -4.8% is a median sale price over the three months ending May 2026. In a bifurcated market, a valuation model that weights the whole housing stock can hold up while median closed sales fall, because the mix of what actually sold shifted toward the softer submarket.
Is the GLX premium permanent or just a novelty bump? The 2023 Green Line Extension hype is now showing up in 2026 as permanent, high-value appreciation, according to observers tracking the corridor. The infrastructure does not go away, and the walk-shed geometry does not change. What can shift is the size of the premium if inner-core prices in Somerville and Cambridge fall far enough to erase the arbitrage.
How competitive is a Medford offer today compared to a year ago? Depends on where. Over the last three months, homes in Medford received an average of 4 offers and sold in around 21 days, with the median sale at $852K, down 4.8% from a year earlier. On the station-adjacent side, tempo is faster than that citywide figure suggests. On the non-station side, it is slower.
What is the sale-to-list ratio actually telling me? Medford homes are closing at roughly 101.3% of asking price, with a citywide average time on market of about 67 days. Read that as two blended numbers: station-adjacent listings pull the ratio above list, non-station listings pull the days-on-market number up. The blend is not a useful benchmark for either.
If you are looking at Medford this fall, the right question is not what the citywide median is doing. It is which of the two Medfords the specific address sits in, and whether the list price was set to the right one. That is the conversation we have with buyers and sellers every week at The Encompass Group. Schedule a consultation and we will run the walk-shed comps on any listing you are considering.